Template Dashboards
Welcome to the Observability Dashboard in our Developer Portal! In this section, we will take you through a guided tour of the Observability Dashboard, where you can explore real-time insights and monitoring data for your applications.
Accessing the Observability Dashboard
- Navigate to the Developer Portal: To access the Observability Dashboard, start by visiting our Developer Portal.
- Catalog View: Once you are on the Developer Portal homepage, choose the "Catalog" option from the menu.
- Filter by Component: In the catalog view, you can filter components to find the one you are interested in monitoring. Locate and select the component that has the Grafana plugin configured for observability.
- Observability Links: Upon selecting the component, you will find dedicated links that provide you with easy access to various observability views:
- Trace View: where you can explore distributed traces and trace details for your application.
- Metric View: where you can visualize and analyze metrics collected by Prometheus. Observe performance trends and detect anomalies in real-time.
- Log View: where you can search and analyze logs from your application. This is invaluable for troubleshooting and understanding application behavior.
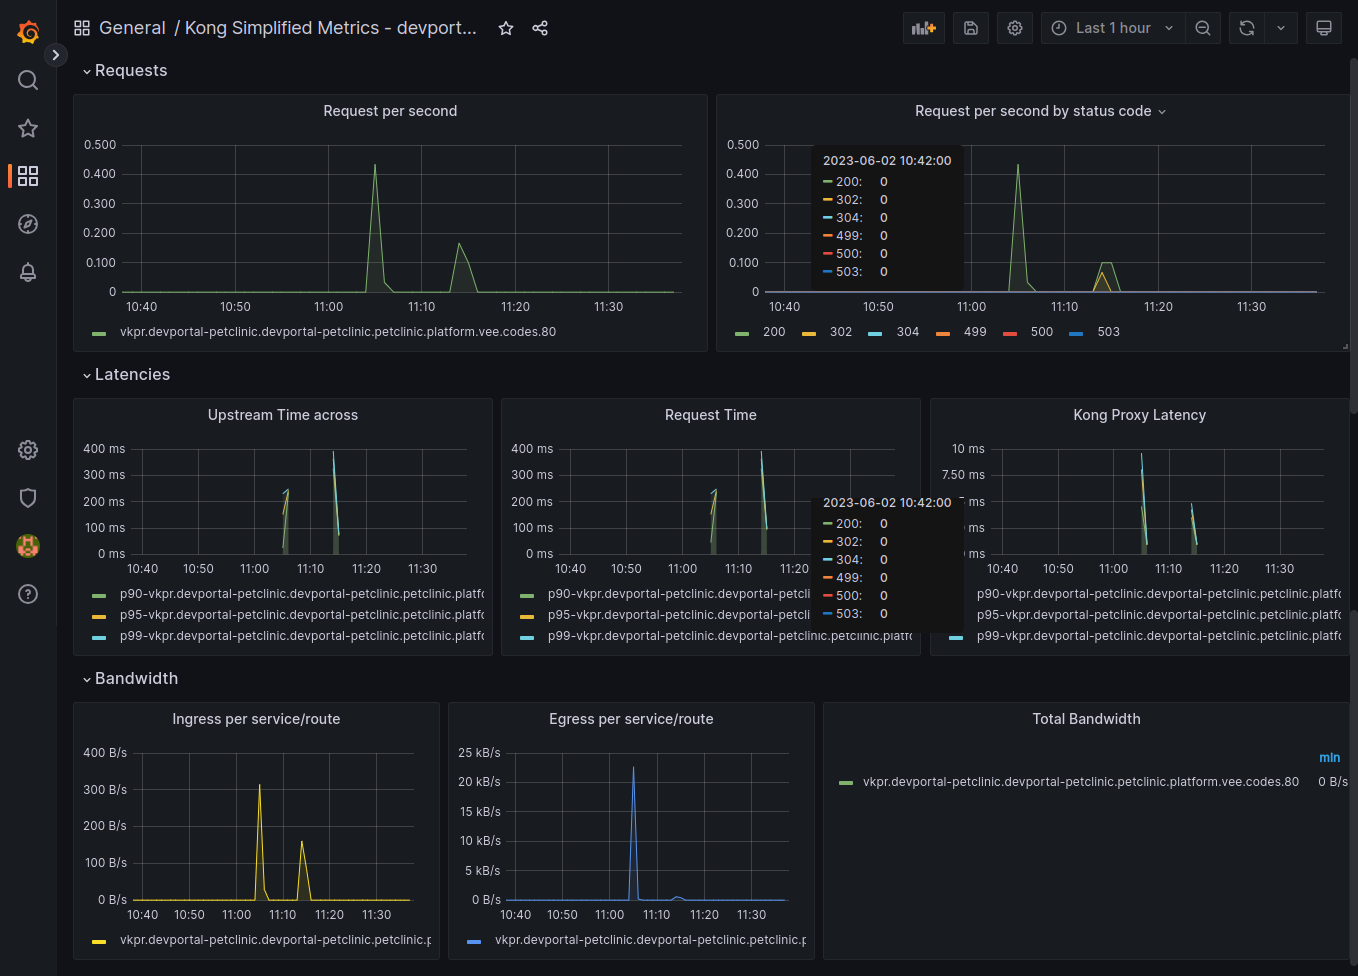
Grafana Dashboard: Metrics View
In the Metrics View of the Observability Dashboard, you will find a collection of interactive and customizable dashboards powered by Prometheus and Grafana. These dashboards offer a rich set of visualizations and widgets that enable you to monitor various aspects of your application's performance, resource utilization, and health.
Key Features:
- Pre-configured Dashboards: We provide a set of pre-configured dashboards that cover common performance metrics for your application, including CPU usage, memory consumption, request latency, and more.
- Customizable Widgets: You have the flexibility to customize existing widgets or create new ones tailored to your specific monitoring needs. This allows you to visualize the metrics that are most relevant to your application.
- Alerting and Notifications: Set up alerting rules to be notified when certain metrics exceed predefined thresholds. Receive notifications via email, Slack, or other channels to take timely actions on critical issues.
- Time-Based Analysis: The Grafana dashboard enables you to analyze historical data by adjusting the time range. This feature allows you to perform retrospective analysis and identify trends over time.
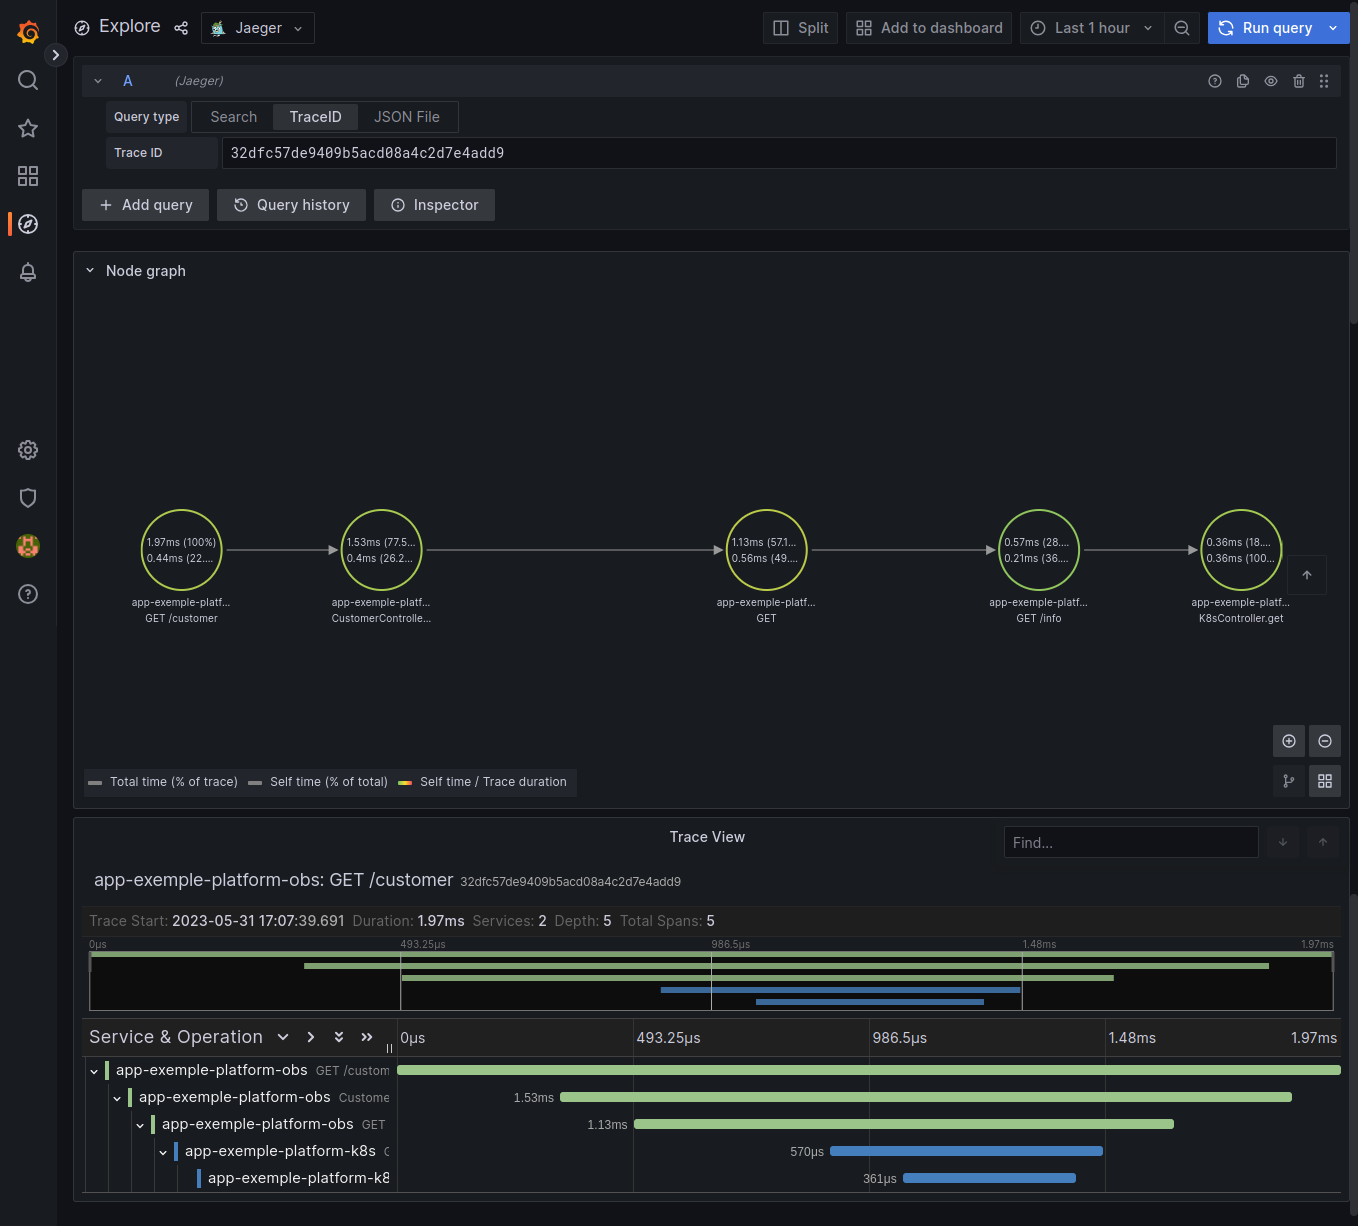
Jaeger Tracing: Trace View
In the Trace View of the Observability Dashboard, Jaeger provides a powerful interface to explore distributed traces across your application. Tracing enables you to visualize the entire flow of a request as it travels through various microservices and components.
Key Features:
- Trace Visualization: Jaeger displays traces as a directed acyclic graph, making it easy to visualize the sequence of calls and dependencies within your distributed system.
- Service Dependencies: Identify the relationships between different services and understand how they interact to process a request.
- Latency Analysis: Trace View allows you to inspect the latency of individual spans (operations) within a trace. Identify bottlenecks and performance issues that impact request processing time.
- Error Analysis: Spot errors and exceptions that occur during request processing and quickly drill down to the root cause for troubleshooting.
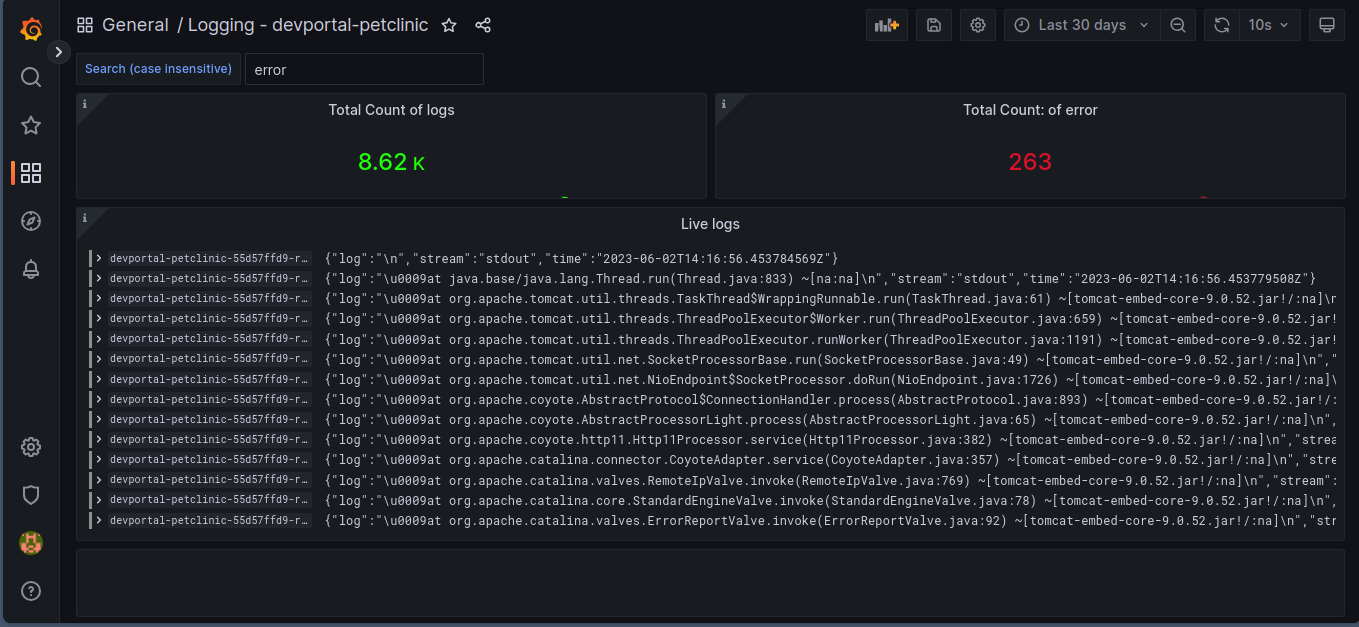
Loki Log Viewer: Log View
The Log View of the Observability Dashboard powered by Loki presents a powerful log aggregation and searching capability. Easily navigate through logs generated by your application to diagnose issues, detect anomalies, and investigate system behavior.
Key Features:
- Log Aggregation: Loki efficiently collects and indexes logs from various sources, allowing you to access logs for your application in a centralized and easily searchable manner.
- Dynamic Queries: Perform dynamic searches using log labels and keywords to narrow down logs relevant to specific components or events.
- Log Visualization: Visualize log data with histograms, bar charts, and other Grafana log-specific visualizations for quick insights.
- Log Stream: Observe logs in real-time with a live log stream view, making it easy to monitor events as they occur.
The Observability Dashboard in our Developer Portal provides you with a powerful set of tools to monitor, troubleshoot, and optimize your applications effectively. By integrating Prometheus, Jaeger, Loki, and Grafana, we offer you a unified and seamless experience to explore metrics, traces, and logs in real-time. Embrace the power of observability to gain a deep understanding of your application's performance, enhance reliability, and foster a proactive DevOps culture.
Reach out to our expert team to schedule a personalized demonstration and discover how our Observability Module can be tailored to meet your organization's unique needs. Our dedicated team will guide you through the platform's capabilities, provide best practices, and help you maximize the benefits of observability.
To book a demonstration or inquire about any aspect of our Observability Module, please don't hesitate to contact us here. We look forward to showcasing the power of observability and how it can transform your application monitoring and management processes.